Systematic Allocation.
Disciplined Capital Preservation.
Apex DAA V11 is Oneiz Capital's current historical research engine. It combines valuation routing, macro-technical protection, a liquid-fund sleeve, and auditable portfolio state transitions.
Apex DAA V11 Framework Apex DAA V11 ResultsApex DAA V11 for changing market regimes
Apex DAA V11 is designed to address the weakness of static exposure: participation can remain attractive while conditions are supportive, but portfolio risk can rise sharply when valuation and market context deteriorate.
The research engine applies a defined decision process to valuation routing, macro protection, contrarian deployment, and low-frequency implementation.
Apex DAA V11 objective
Seek long-term equity participation while keeping capital preservation and disciplined reallocation central to the process.
Apex DAA V11 Research Framework
Valuation Routing
Apex DAA V11 routes equity exposure using monthly broad-market valuation conditions, including the published P/E thresholds.
Macro Protection
Apex DAA V11 applies a 1,050-trading-day M50 EMA context and a 12-month crash lock for severe macro dislocations.
Auditable Implementation
Apex DAA V11 uses a 10% symmetric drift buffer and records portfolio transitions for research auditability.
Apex DAA V11 Nifty 50 Research Results
Validated historical run | 1999-07-01 to 2026-09-16 | Nifty 50 | INR 80,000 monthly systematic inflow
Apex DAA V11 benchmark readout
Apex DAA V11 reached INR 416,856,597.58 versus INR 222,165,520.57 for the passive TRI SIP. The model produced 16.76% XIRR versus 13.26%, 16.03% CAGR versus 13.05%, and a less severe maximum drawdown of -50.23% versus -59.50%.
- Final valueINR 416,856,597.58 for Apex DAA V11.
- Total investedINR 26,160,000.00 across both SIP comparisons.
- Rebalances38 recorded Apex DAA V11 rebalances.
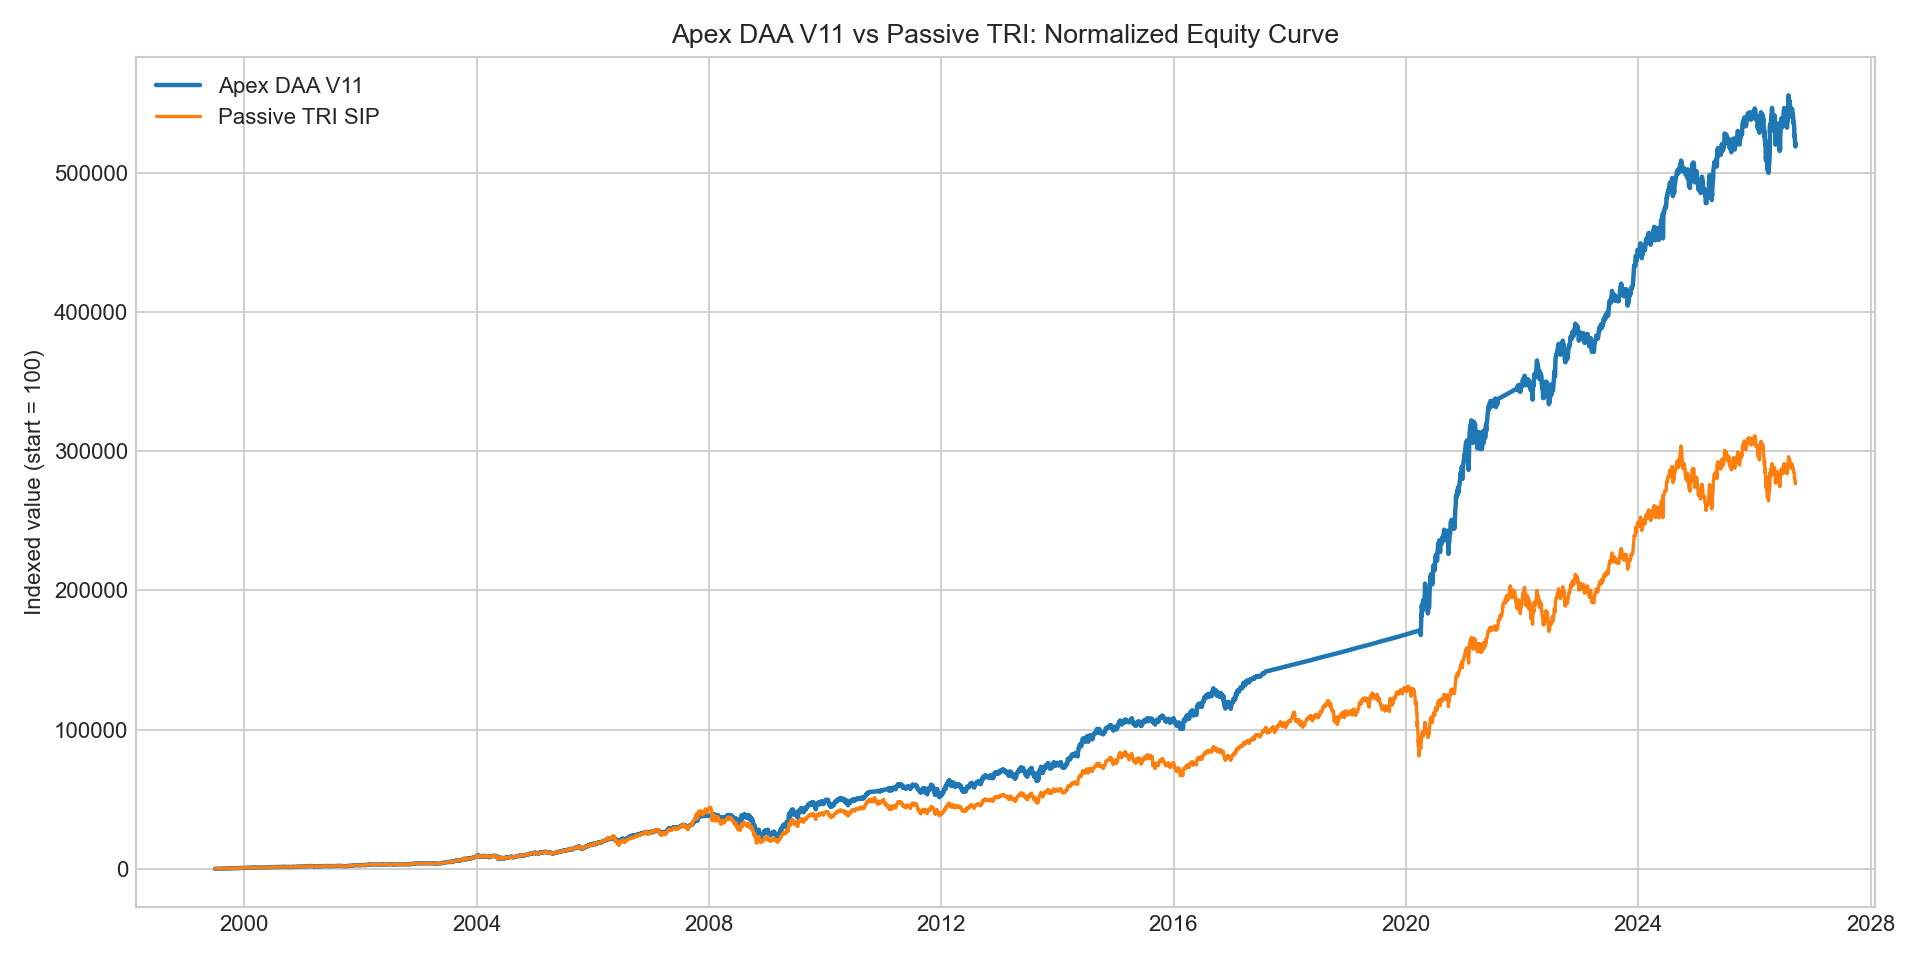
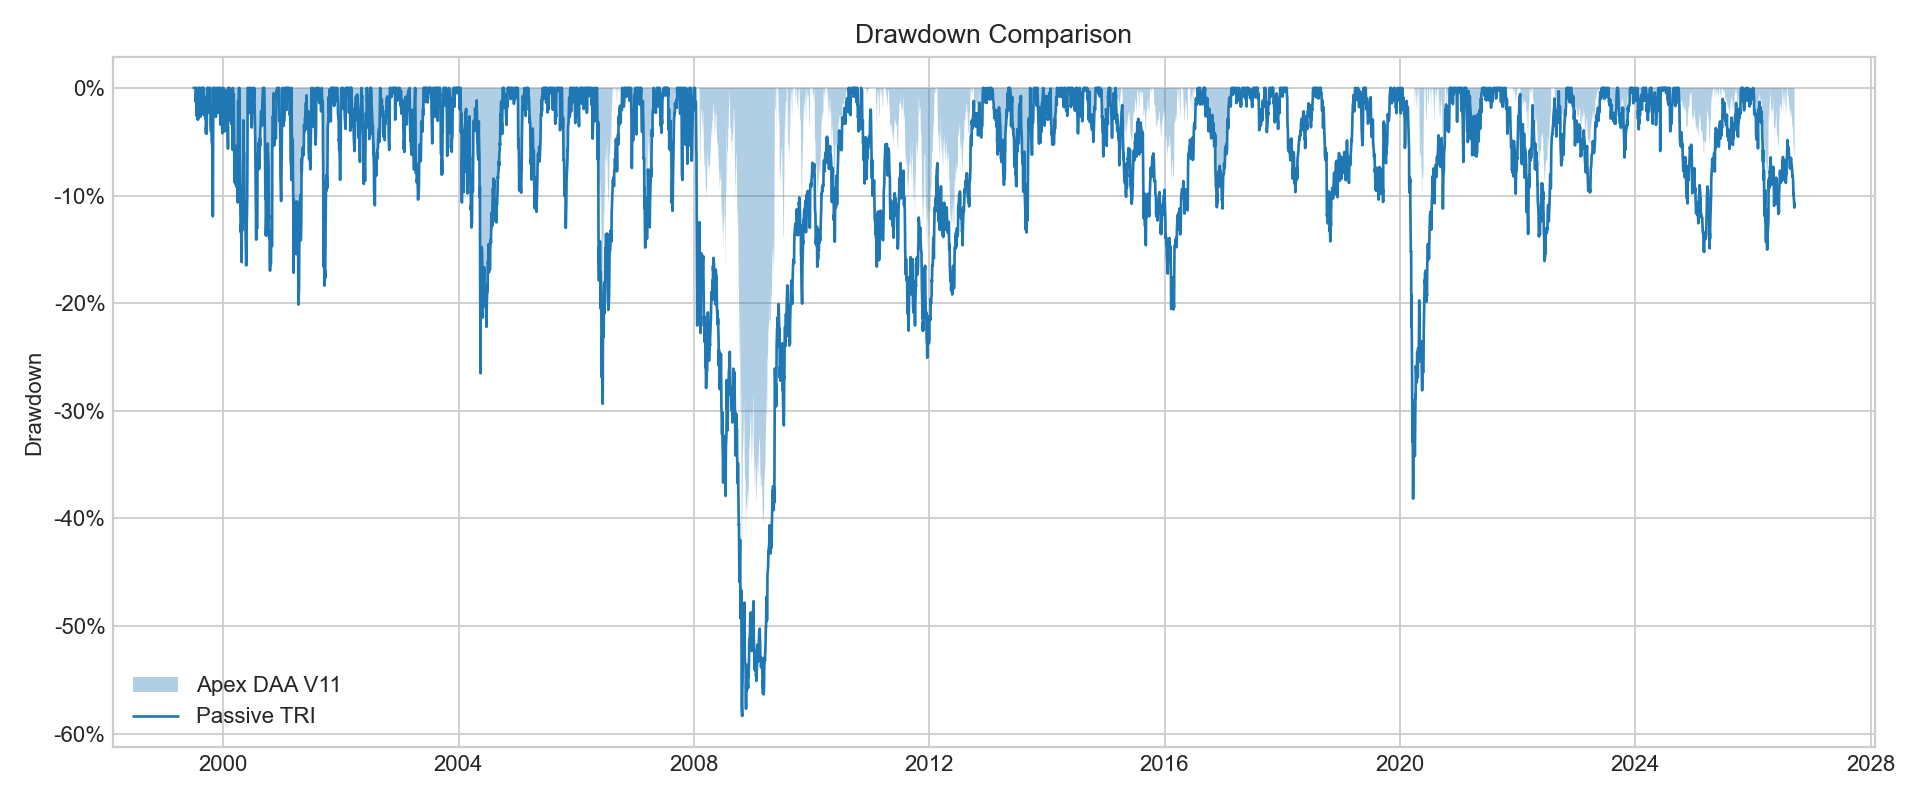
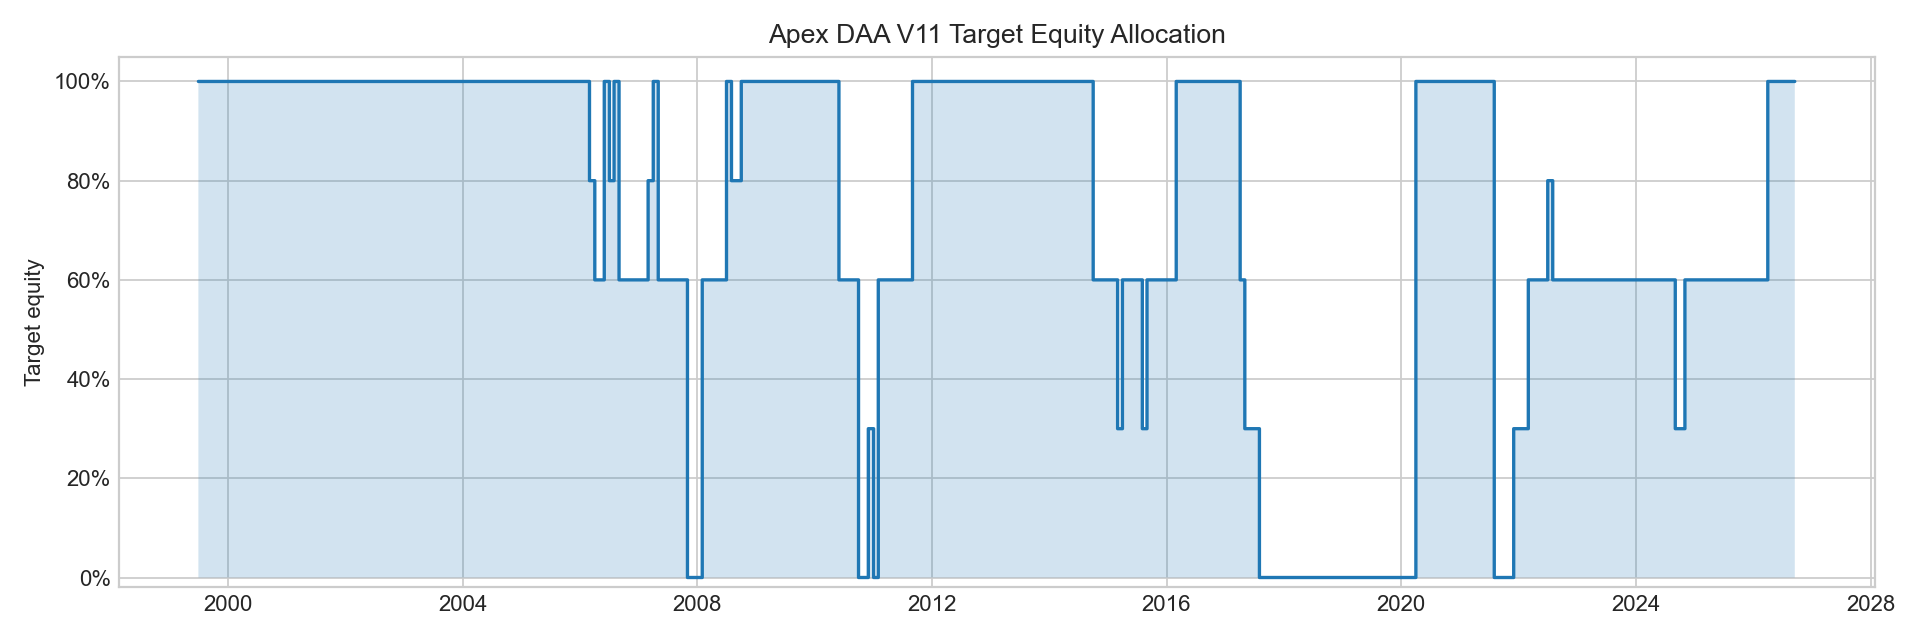
Historical and backtested results are not a live audited track record, a forecast, or investment advice. Results depend on index history, data availability, assumptions, execution costs, and parameter stability. Passive TRI comparison values are from the same validated research run.
Apex DAA V11 Institutional Research Access
Qualified institutional parties may request the Apex DAA V11 methodology, source data, rebalance audit, and implementation discussion.
Apex DAA V12 is the separate production signal layer; this page presents the V11 historical research baseline.
Apex DAA V11 research desk
Detailed model materials and implementation protocols are shared through appropriate institutional due diligence.
Contact the Apex DAA Desk